Image generated by OpenAI’s DALL·E via ChatGPT
From Disaster to Decision
Spatial and Temporal Patterns in Disaster-Affected Voting
Defense in Summer 2025
About the project
As climate change intensifies, so does the frequency of disruptive storms and natural disasters. There are several studies that identify causal relationships between natural disasters and voting behavior, but these are often limited to individual storms. Few have attempted to understand this linkage on the national scale. I fill this gap by operationalizing three concepts at the county level:
(1) whether voters live in a county directly hit by disaster;
(2) whether voters live in a county with a population centroid within a short-to-medium distance from disaster; and
(3) whether voters react differently to varying levels of disaster severity.
Keep scrolling or click below to jump ahead
Why is this important?
If voters exercise consistent patterns of reward and punishment, then the stakes are raised for elected leaders to implement good public policy. Campaigns in recent years have done a lot of work to assure voters that candidates are either climate change “believers” or “deniers.” These policy preferences are on display when a candidate is in office. Media attention is focused on how incumbent leaders react to disaster. For example, do they prioritize proactive solutions, like bolstering levy infrastructure before a hurricane? Or, do they deliver a generous recovery package? Studies suggest that incumbents receive a greater electoral reward for policies implemented after the fact even though some argue that proactive policy might significantly reduce a disaster’s damage to begin with.
Hurricanes, wildfires, and tornadoes
My dissertation surveys gubernatorial and presidential turnout and returns for the 3,066 counties and parishes in the contiguous United States. I focus on hurricanes, wildfires, and tornadoes that took place within six months prior to gubernatorial elections in 2016, 2018, 2020, and 2022, or, presidential elections in 2016 and 2020.
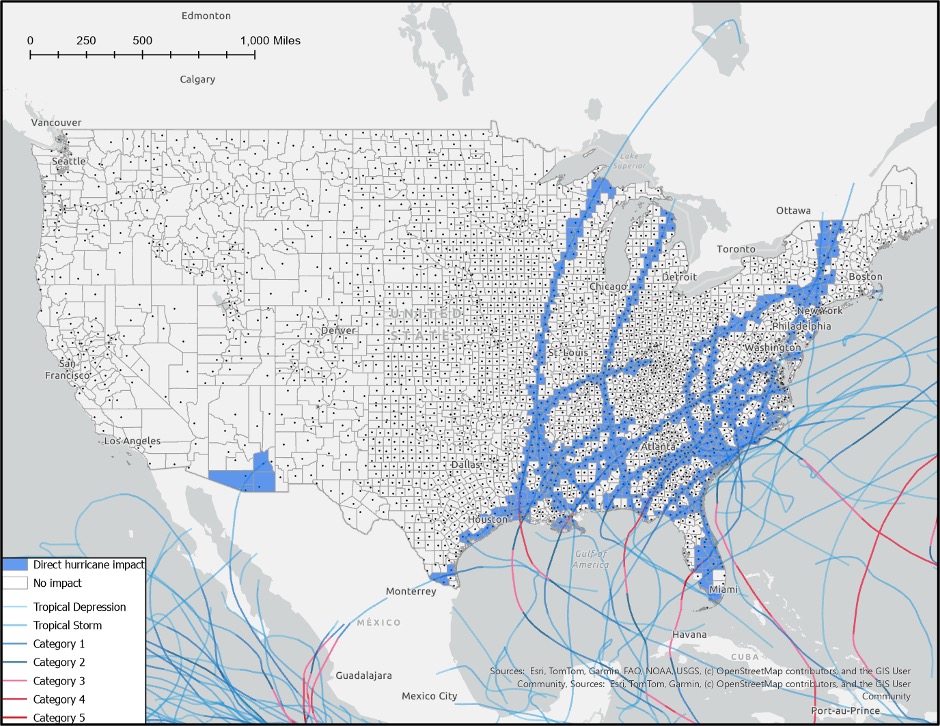
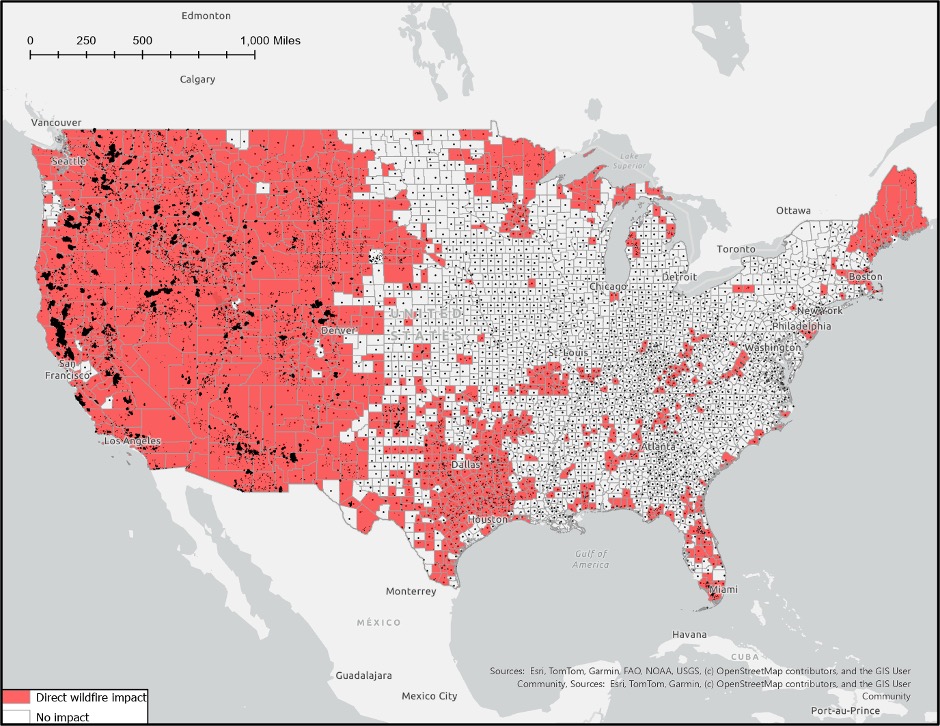
From left to right, these maps identify counties that were directly impacted by hurricanes, wildfires, and tornadoes in the six-month treatment periods for 2016, 2018, 2020, and 2022.
Measures
Direct impact
Dummy variable that takes on values of one if a disaster takes place in a county.
Near distance
Dummy variable that takes on values of one if a county’s population centroid is within a certain distance of a disaster.
Severity
Measures like air pressure and wind speed, acres burned, or tornado magnitude for counties directly impacted by disaster.
Direct impact vs. near distance
One of the main methodological innovations of this dissertation is how it defines being impacted by natural disaster.
First, a county is directly impacted when the natural disaster occurs or travels through its borders. Here, I test the durability of the county line as a determinant of voting behavior.
Second, the near distance measure identifies which counties have a population centroid within a specified distance of a disaster. This measure sharpens the focus on how the individual voter is impacted by disaster and prioritizing the average concentration of people.
Severity
Each disaster dataset contained measures of disaster severity. There was no systematic way to determine things like cost for hurricanes, since these measures are typically calculated for larger geographies or an entire storm. Tornadoes are, however, usually contained to one small area within a county and thus provide reliable estimates for human and monetary cost. Across all four disaster types, I computed distance or area
Hurricanes
- Natural log of distance travelled
- Wind speed (miles per hour)
- Air pressure (millibars)
Wildfires
- Acres burned (acres)
Tornadoes
- Natural log of distance travelled
- Magnitude (EF scale)
- Injuries
- Fatalities
- Property loss (dollars)
- Crop loss (dollars)
Natural experiment and OLS
I test direct impact and near distance impact using a difference-in-differences natural experiment. This allowed me to estimate treatment effects for each disaster type in treated counties for each of the four election periods.
To determine the impact of disaster severity, I used a basic OLS multiple regression setup.
In the end, there were over 100 regression equations.
